Greenridge Research Paper: Underwritten Income
A Structural Advantage for Balanced Portfolios in a Repriced Macro Environment
About this paper
This paper sets out Greenridge’s house view on the role of underwritten income within UHNW portfolio construction, framed against the macroeconomic environment of mid-2026. We argue that contractually secured rental income, drawn from UK commercial property, provides a structural advantage that has been reinforced by the breakdown of conventional bond-equity diversification, a higher structural level for UK Gilts, and the political and geopolitical risk premia now embedded in sterling assets.
The 2026 energy shock and its rapid unwind are used here as a live illustration of that argument rather than as its foundation. The case for income-led property does not depend on any single event. It rests on the character of the income itself.
The paper is written for professional advisers, family office principals, multi-family office allocators, and institutional investors evaluating allocations to UK commercial real estate. It combines Greenridge’s investment perspective with current market data and third-party research to support an evidence-led allocation discussion.
Greenridge Investment Management
Greenridge is an independent, privately-owned and partner-led investment manager that has specialised in UK commercial property for over three decades. Leveraging the combined power of our own balance sheet and third-party capital, our strategy is to acquire and manage institutional-grade assets with strong real estate fundamentals that generate positive risk-adjusted returns irrespective of the investment cycle, creating consistent value for our clients and partners. Greenridge is an Appointed Representative of Robert Quinn Advisory LLP for FCA purposes.
Executive Summary
The case for income-led commercial real estate within balanced portfolios for both institutional and UHNW investor types has not weakened through 2026. It has strengthened. We make four arguments.
01. The 2026 macro environment has raised the value of contractually secured income.
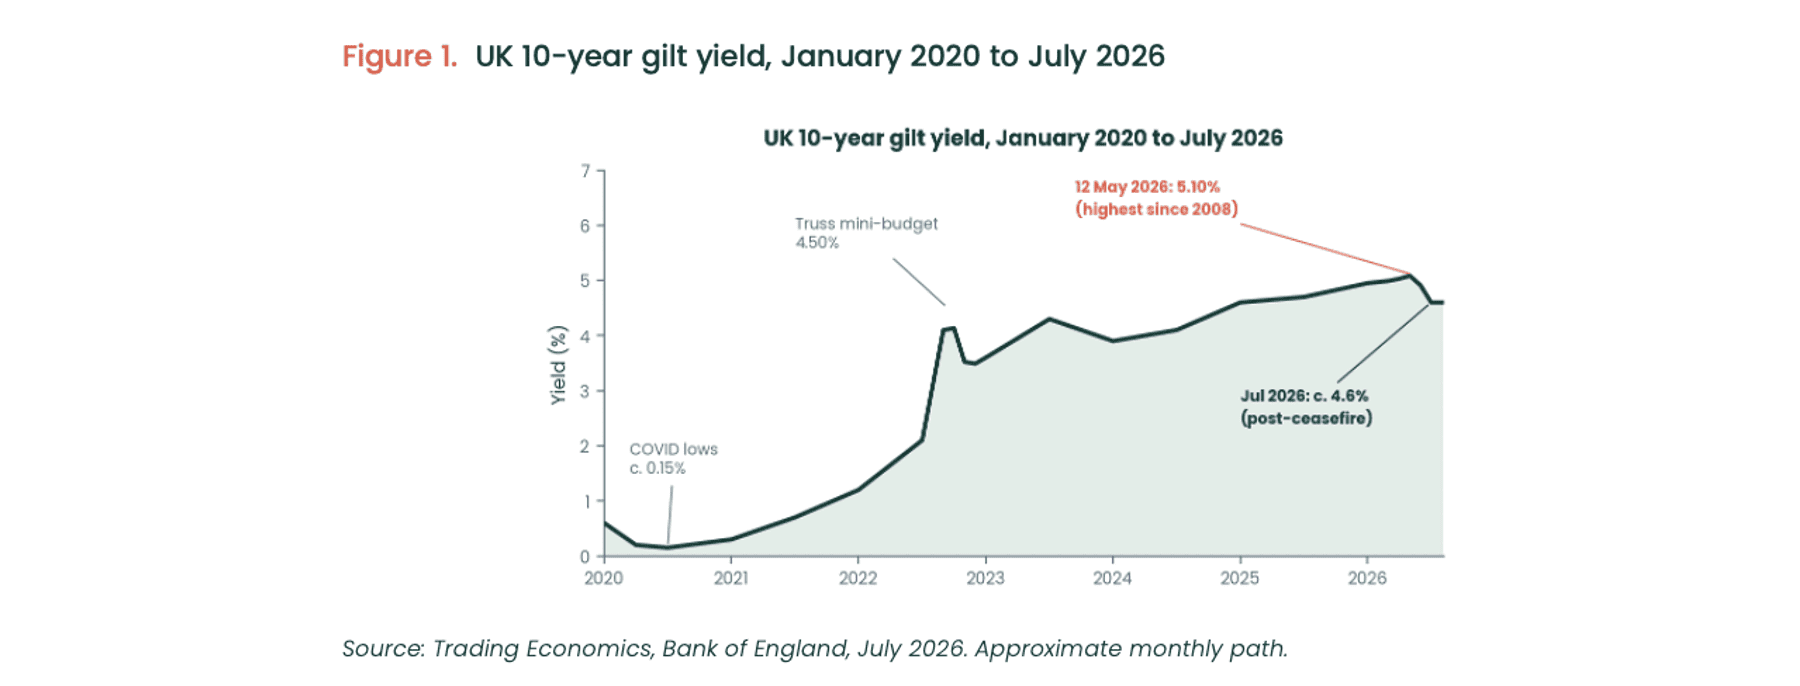
Sterling rates have reset to a higher structural level than the 2021 baseline on which much recent portfolio thinking rested. The UK 10-year gilt yield touched 5.10% on 12 May 2026, its highest since 2008, before falling back to around 4.6% by early July as the Middle East conflict de-escalated. The Iranian conflict pushed Brent crude above $100 in March and closed the Strait of Hormuz, then reversed within months, predicated on a US-Iran peace framework. Equity-bond correlations, negative for most of the past two decades, turned positive again during the shock. Income that is contracted, indexed, and asset-backed holds a scarcity value through episodes like this that listed-market income does not.
02. The character of yield matters as much as the quantum.
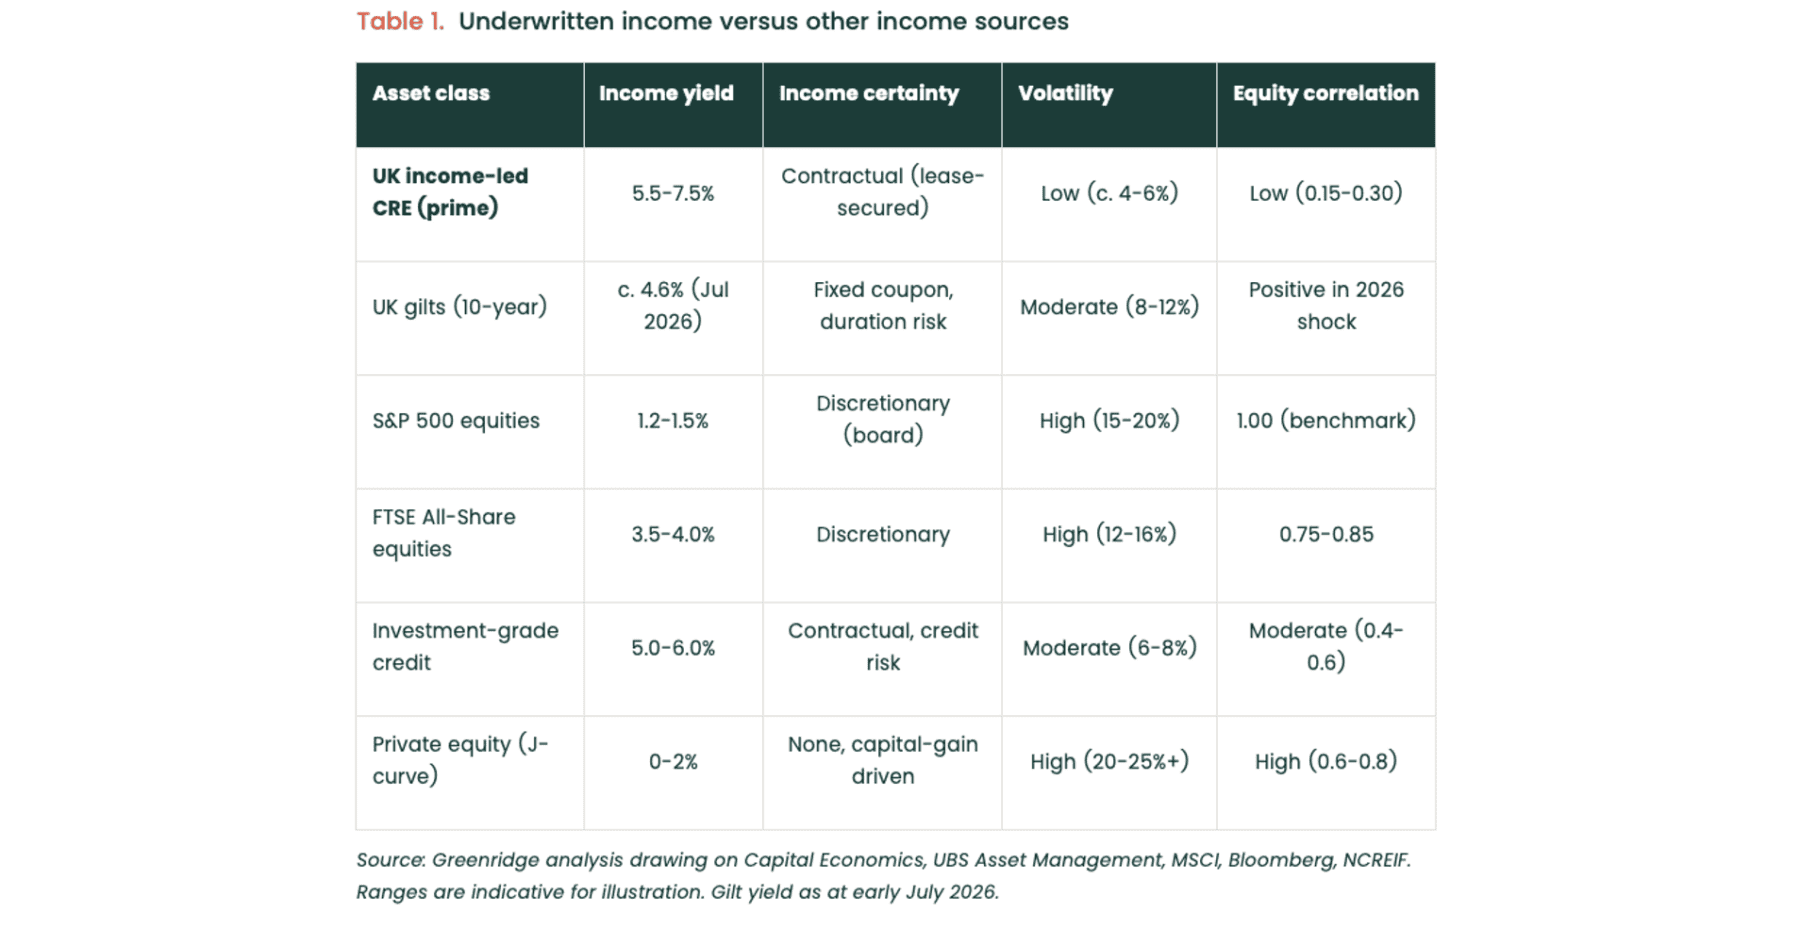
A gilt (bond) coupon, an equity dividend, and a commercial property income yield are not equivalent even at similar headline levels. The gilt carries duration and reinvestment risk and now correlates with equities. The dividend is discretionary. Property income is contracted, secured against a physical asset, and frequently indexed. The relevant comparison is income certainty under stress, rather than a simple yield-on-yield ranking.
03. A 15-20% allocation to income-led UK commercial real estate improves balanced portfolio outcomes.
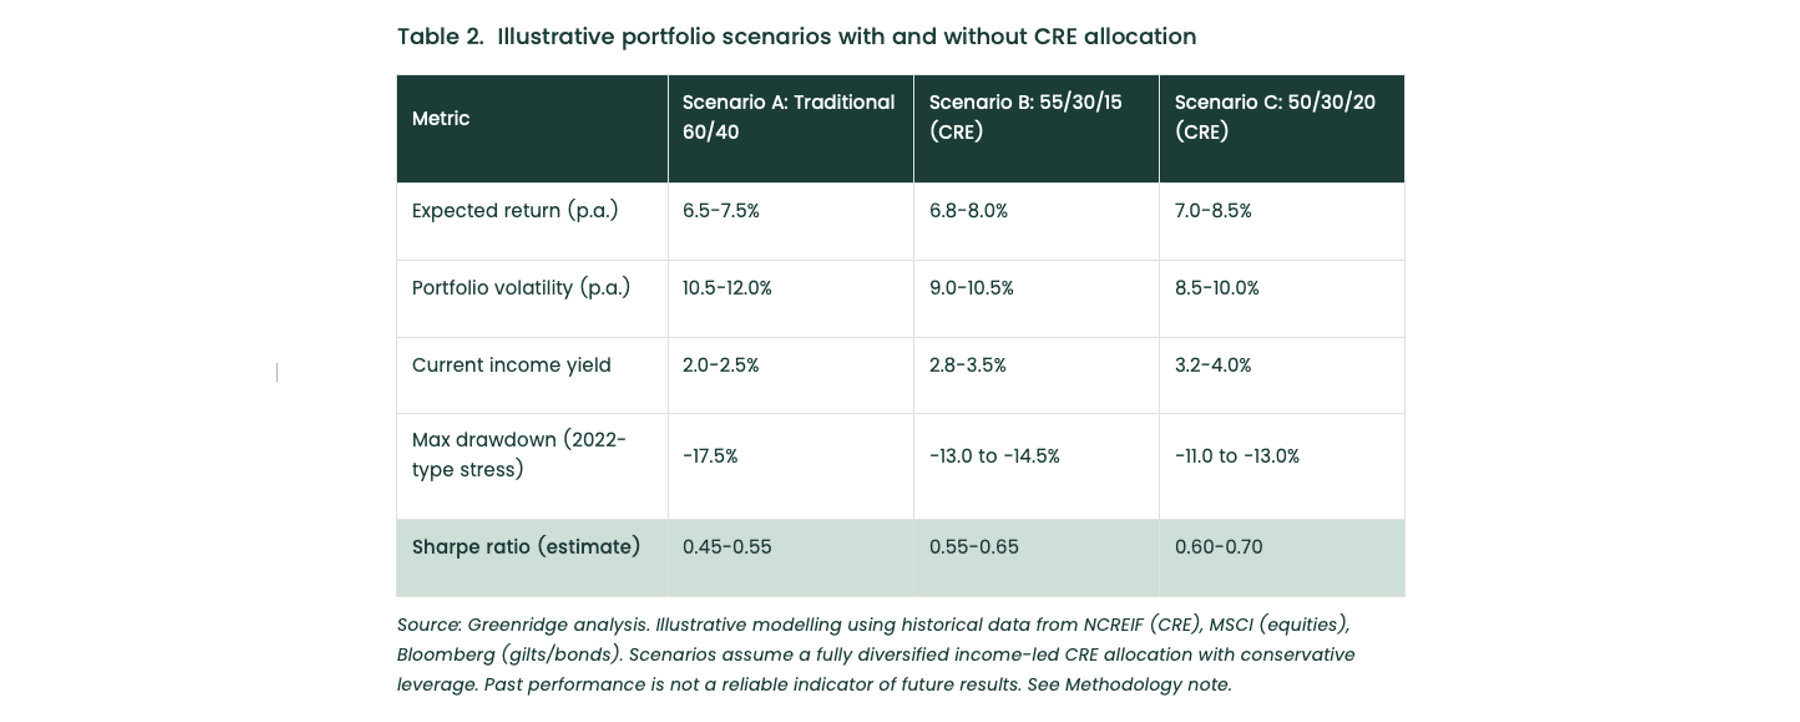
Our modelling, drawing on NCREIF, MSCI, and Bloomberg data, indicates that adding 15-20% private income-led CRE to a traditional balanced portfolio raises current income yield by approximately 100 basis points, reduces volatility by 150-200 basis points, and improves the Sharpe ratio by 0.10 to 0.20 versus a conventional 60/40.
04. For overseas capital, the alignment is structural.
Preference for tangible assets, capital preservation alongside growth, multi-generational wealth structures, the appeal of UK rule-of-law jurisdictions, and compatibility with ethical-conscious frameworks combine to make UK income-led property a structurally suitable allocation for family offices and sovereign capital. Taking GCC sovereign wealth funds for example, they now manage close to US$6 trillion, more than 40% of global SWF assets, and deployed US$12.85 billion into European deals in the first half of 2025 alone.
1. The Macro inflection of 2026
Portfolio construction questions in mid-2026 are being asked in conditions that did not exist eighteen months ago. The year has combined a sharp geopolitical shock with a rapid unwind, and the sequence has left several structural features of the landscape exposed. Five shifts deserve specific attention.
1.1 The Government Bond rate environment has reset to a higher level
The UK 10-year gilt yield touched 5.10% on 12 May 2026, its highest level since 2008, and the 30-year gilt reached the region of 5.8% earlier in the year. Yields have since retraced, with the 10-year back to around 4.6% by early July as the energy shock eased. The Bank of England has held Bank Rate at 3.75% throughout 2026, most recently on 17 June on a 7-2 vote, with two members preferring an increase to 4.00%. The next decision is due on 30 July. Markets are pricing a broadly flat-to-modestly-higher path for the remainder of the year rather than the cuts expected twelve months ago. The premise of a benign falling-rate environment no longer applies, even after the recent retracement.
1.2 Inflation has cooled from its 2026 peak, but the picture is mixed
UK CPI inflation peaked at 3.3% in March 2026 during the energy shock and has since eased to 2.6% in June, -.02% lower than in May. The composition has rotated: energy and food inflation have receded as oil prices fell, while services inflation rose to 3.6% and transport inflation accelerated. The Bank of England judges that CPI could edge higher again later in 2026 as earlier energy increases feed through, and it continues to flag the risk of second-round effects in wages and prices. For income strategies, the implication holds in either direction: nominal yields on instruments without inflation linkage are exposed in real terms, while indexed and uplift-protected rental income retains its real value.
1.3 Geopolitics and the energy shock: a live case study in repricing
The 2026 Middle East conflict is the clearest recent illustration of why the character of income matters. The US-Israel military campaign against Iran began on 28 February 2026, and the effective closure of the Strait of Hormuz, together with a US blockade of Iranian ports from April to late May, removed material daily supply from oil markets. Brent crude passed $100 per barrel on 8 March for the first time in four years and peaked near $120. A US-Iran peace framework, mediated by Pakistan and in force from mid-June, then reopened the strait and lifted the blockade. Brent fell back to around $72 by early July, close to four-month lows, supported by OPEC+ raising output. Vessel traffic through the strait has largely normalised, though isolated incidents show the settlement remains fragile.
The episode moved oil, gilt yields, and cross-asset volatility sharply over a matter of weeks, then unwound almost as quickly. Listed assets repriced on the news flow at each stage. Contracted rental income did not. That asymmetry, visible in real time this year, is the core of the argument this paper makes.
1.4 Bond-equity diversification has broken down again
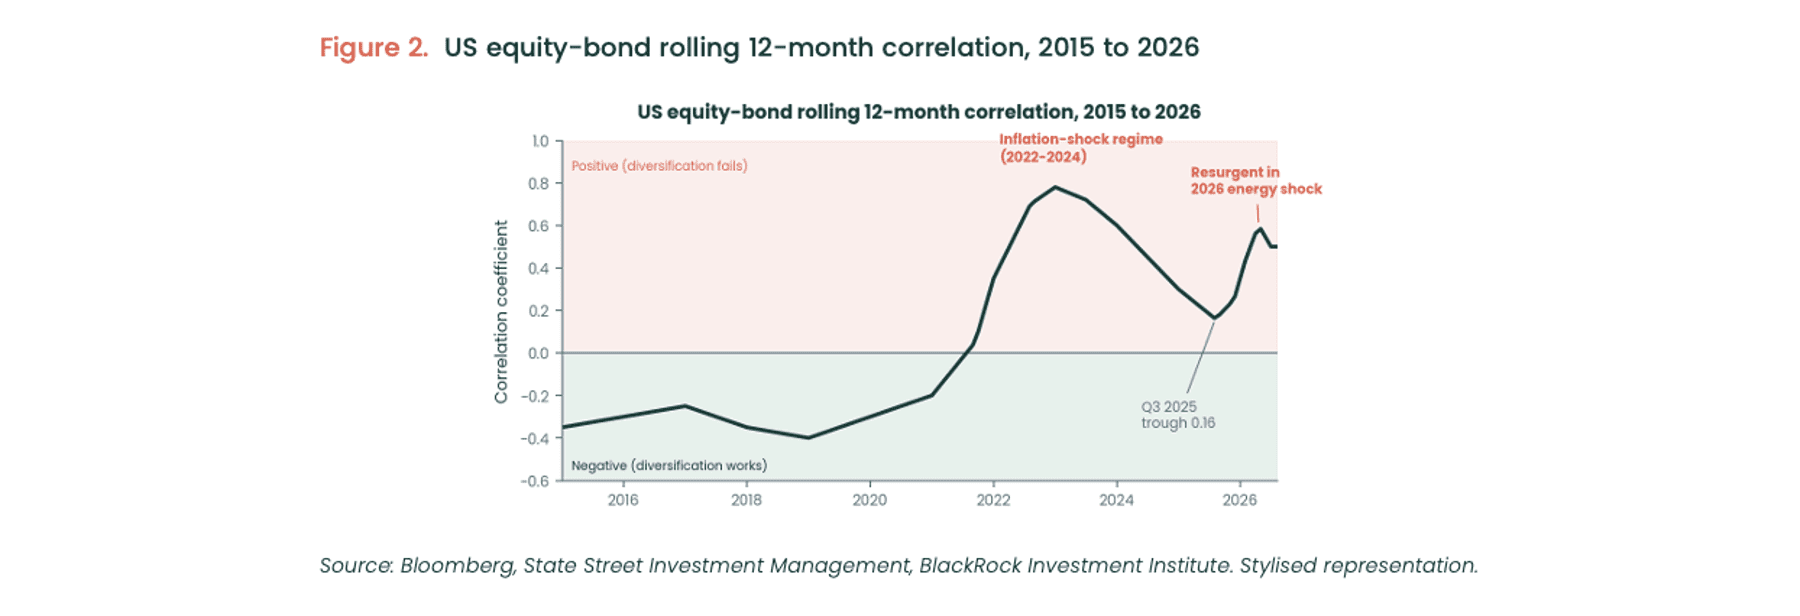
For most of the past two decades, the negative correlation between equities and bonds was the cornerstone of balanced portfolio construction. That assumption broke in 2022, when inflation became the dominant macro variable and both asset classes fell together. The 60/40 portfolio declined roughly 17% in 2022, one of its worst calendar years in modern history. The 12-month rolling correlation eased to around 0.16 by the third quarter of 2025 before turning positive again through the 2026 energy shock. Some managers, including the BlackRock Investment Institute, expect a reversion toward negative correlation as inflation volatility falls. The reliable conclusion for allocators is that the bond hedge cannot be assumed to work in every regime.
1.5 UK political risk is embedded in sterling assets
The UK political backdrop has remained a source of fiscal uncertainty through 2026, with a change of Labour leadership under way and gilt markets continuing to price a degree of sovereign risk. We treat this as a real but bounded factor. It has widened risk premia at the macro level, while UK property law, lease enforcement, and tenant covenants remain among the most robust globally. Property income is asset-secured and largely insulated from short-term political cycles.
HOUSE VIEW
None of these shifts argues for retreating from UK assets. They argue for being more disciplined about what UK exposure delivers. Listed UK assets are exposed to political and rate volatility on every trading day. Income-led commercial property is exposed to it only at points of valuation, refinancing, or rent review. That asymmetry is what we looking to take advantage of, and 2026 has demonstrated it in the open.
2. Why income certainty carries a scarcity premium
In an environment where every public-market income stream has become more uncertain, the residual category of contractually secured income carries a scarcity premium. The repricing has come from four directions.
-
Equity income has become more volatile
Global equity markets remain heavily concentrated. In the United States, a narrow cohort of AI-related mega-cap stocks has driven the majority of index returns, with 44 of 46 AI stocks experiencing drawdowns of at least 20% during 2025, according to BlackRock. Oppenheimer’s 2026 Market Outlook observed that the S&P 500’s forward earnings yield had converged close to the 10-year US Treasury, producing an equity risk premium of approximately 0.02%, among the lowest on record. Cambridge Associates reports that the average allocation to public and private equity among US endowments and foundations rose from 51.7% in June 2015 to 64.8% in June 2025, embedding significant concentration into institutional portfolios at the same time as dispersion within equity returns has widened.
-
Bond coupons carry duration risk that current yields do not fully compensate for
A UK 30-year gilt has duration of approximately 16 years. A 100 basis point rise in yields produces a capital loss of approximately 16%, far exceeding a single year’s coupon. The 2026 rate round-trip, from 5.10% in May back toward 4.6% in July, is a reminder of how quickly that duration exposure can move value. Reinvestment risk compounds the issue: as higher-yielding positions mature, replacement yields may be lower, undermining income streams that appeared secured at purchase.
-
Private equity income does not exist during the J-curve
Private equity has become a staple allocation across all portfolio types, but its return profile is back-end loaded and produces minimal current income, especially during a fund’s J-curve phase. The 2026 Long Angle High-Net-Worth Asset Allocation Study reports that high-net-worth investors hold over a quarter of net worth in private and alternative assets, yet the lack of distributions during the early years creates a structural cashflow mismatch for families requiring ongoing income for lifestyle, philanthropy, or intergenerational structures.
-
Cash yields are set to normalise downwards
Money market and cash-equivalent yields, compelling through 2024 and 2025, are likely to compress as the rate cycle eventually turns. BlackRock notes that with an unusually large amount of capital concentrated in cash, income generation is increasingly a portfolio-level priority for both institutional and private investors. The window for holding cash without opportunity cost is closing.
HOUSE VIEW
Income certainty is the scarce resource of this cycle. Every other yield-bearing asset carries either discretionary risk, duration risk, credit risk, or path risk that did not exist in the same form a decade ago. Long-WAULT, prime, investment-grade-tenanted commercial property is the asset class best positioned to deliver income certainty in current conditions.
3. What “underwritten income” means
Underwritten income describes a rental income stream that is contractually secured at the asset level through a combination of lease structure, tenant creditworthiness, and physical asset quality. It is the characteristic that distinguishes income-led commercial real estate from a generic high-yield allocation, and it rests on five components.
3.1 Contractual leases with defined terms
UK commercial property leases are legally binding contracts specifying rental amounts, payment frequency, lease duration, break clauses, and review mechanisms. Equity dividends can be reduced or suspended at board discretion, and bond issuers can default. Contracted rent is a legal obligation of the tenant, enforceable through the English courts and ultimately secured by the physical asset.
3.2 Tenant covenant strength
Income certainty is only as robust as the tenant’s ability to pay. Covenant strength is assessed through profitability, leverage, parent guarantees, and credit ratings where available. Income-led portfolios are deliberately weighted toward tenants with institutional-grade covenants: government entities, national retailers, multinational corporates, regulated utilities, and large healthcare operators. The probability of default for such tenants is materially lower than for speculative-grade credit exposure.
3.3 Weighted average unexpired lease term (WAULT)
WAULT is the primary metric for income duration across a multi-tenant property or portfolio. It represents the average remaining lease term, weighted by rental income, expressed in years. A WAULT to expiry of eight to twelve years indicates that the majority of rental income is secured by contracts that will not expire for nearly a decade. Properties with long WAULTs and strong covenants command premium valuations and lower capitalisation rates, reflecting the reduced risk priced into them.
3.4 Indexation and fixed uplifts, with a 2026 legal update
Many UK commercial leases incorporate rent review mechanisms providing inflation-linked indexation (commonly CPI or RPI) or fixed annual uplifts, typically 1.5-3.0% per annum. These mechanisms offer a built-in inflation hedge that bond coupons, fixed at issuance, cannot provide.
A significant legal development has now moved from proposal to statute. The English Devolution and Community Empowerment Act 2026 received Royal Assent on 29 April 2026 and, once in force, will ban upward-only rent review mechanisms in new commercial leases in England and Wales. The provisions are not yet in force. Commencement will be set by secondary legislation and is expected no earlier than 2027, and a targeted anti-avoidance measure backdated to 17 March 2026 catches renewal arrangements entered into from that date. We take a clear and precise position on scope. The ban applies to variable, upward-only reviews where the reviewed rent is not ascertainable at grant, which covers open-market, index-linked, and turnover reviews structured so that rent cannot fall. Fixed or stepped uplifts, where the rent is fixed at the outset, are unaffected. Index-linked reviews may continue on a two-way basis, and the government has committed to consult on whether caps and collars will be permitted. Greenridge’s underwriting already prioritises fixed and stepped uplifts and long-WAULT leases with strong covenants, and structures index-linked reviews on terms compatible with the reform. The income legislation further helps underwriting certainty of income and projected cash flows.
3.5 Asset-level security
Unlike unsecured corporate bonds or equities, the landlord’s income claim is secured by the physical asset. In a default scenario, the landlord retains possession and can re-let to a replacement tenant. For well-located, prime-quality assets in established sub-markets, re-letting timelines are typically a matter of months. The asset’s intrinsic utility, as essential space for the conduct of commercial activity, is what underwrites the recoverability of income across cycles.
4. Structural portfolio benefits
Allocating 15 to 20% of a balanced portfolio to income-led private commercial real estate delivers three structural benefits that traditional 60/40 construction does not provide.
4.1 Cashflow predictability
For UHNW families and their advisers, and institutions alike, the ability to forecast income with high confidence over multi-year horizons has significant practical value. Quarterly distributions from income-led commercial property can support lifestyle drawdowns, philanthropic commitments, and family office operating costs without forcing liquidation of growth assets at inopportune valuations. Accordant Investments reports that a significant portion of private CRE total return is attributable to regular tenant rent payments, with core private CRE historically generating an income spread of approximately 252 basis points above the US 10-year Treasury since 2000.
4.2 Downside cushioning
Income durability cushions valuation volatility. During the 2022 to 2024 downturn, UK property values fell by approximately 25%, yet rental income in sectors such as industrial and logistics continued to grow, with industrial rents rising more than 20% over the same period, according to Schroders. This differs structurally from the Global Financial Crisis, when falling values and falling rents moved in tandem. The income-led strategy benefits from the divergence: the valuation may oscillate with rates and sentiment, while the income stream that ultimately drives long-term return continues to compound.
4.3 Diversification efficiency
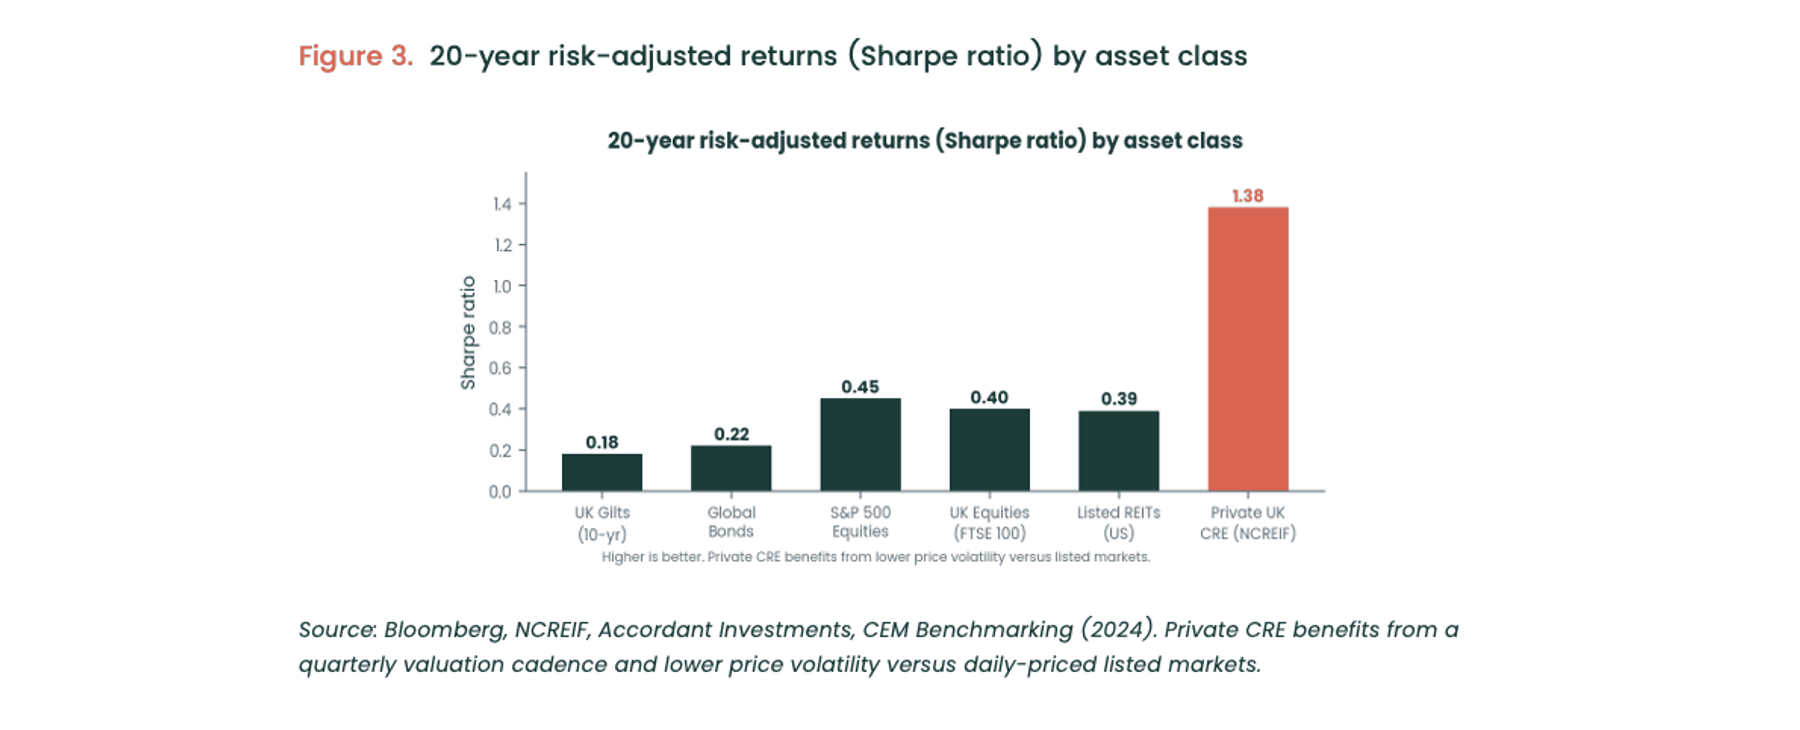
Private commercial real estate has historically exhibited low correlation with both equities and bonds. Over a trailing 20-year period, private CRE generated among the strongest risk-adjusted returns of any major asset class, with a Sharpe ratio of 1.38 and annualised volatility of just 4.4%, a fraction of the volatility borne by equity investors. Adding even a modest allocation can reduce overall portfolio volatility while maintaining or improving total return.
HOUSE VIEW
We position 15-20% as the optimal allocation range for balanced portfolios. Below 10% the diversification benefit is too small to alter overall portfolio outcomes. Above 25% the liquidity profile of the portfolio is materially impaired. The 15-20% range captures most of the diversification benefit while preserving portfolio flexibility.
5. The UK market in 2026
The UK commercial property market is operating in conditions that demand careful selectivity while also offering compelling entry points for disciplined long-term capital.
5.1 Pricing has reset, and the spread over gilts has re-widened
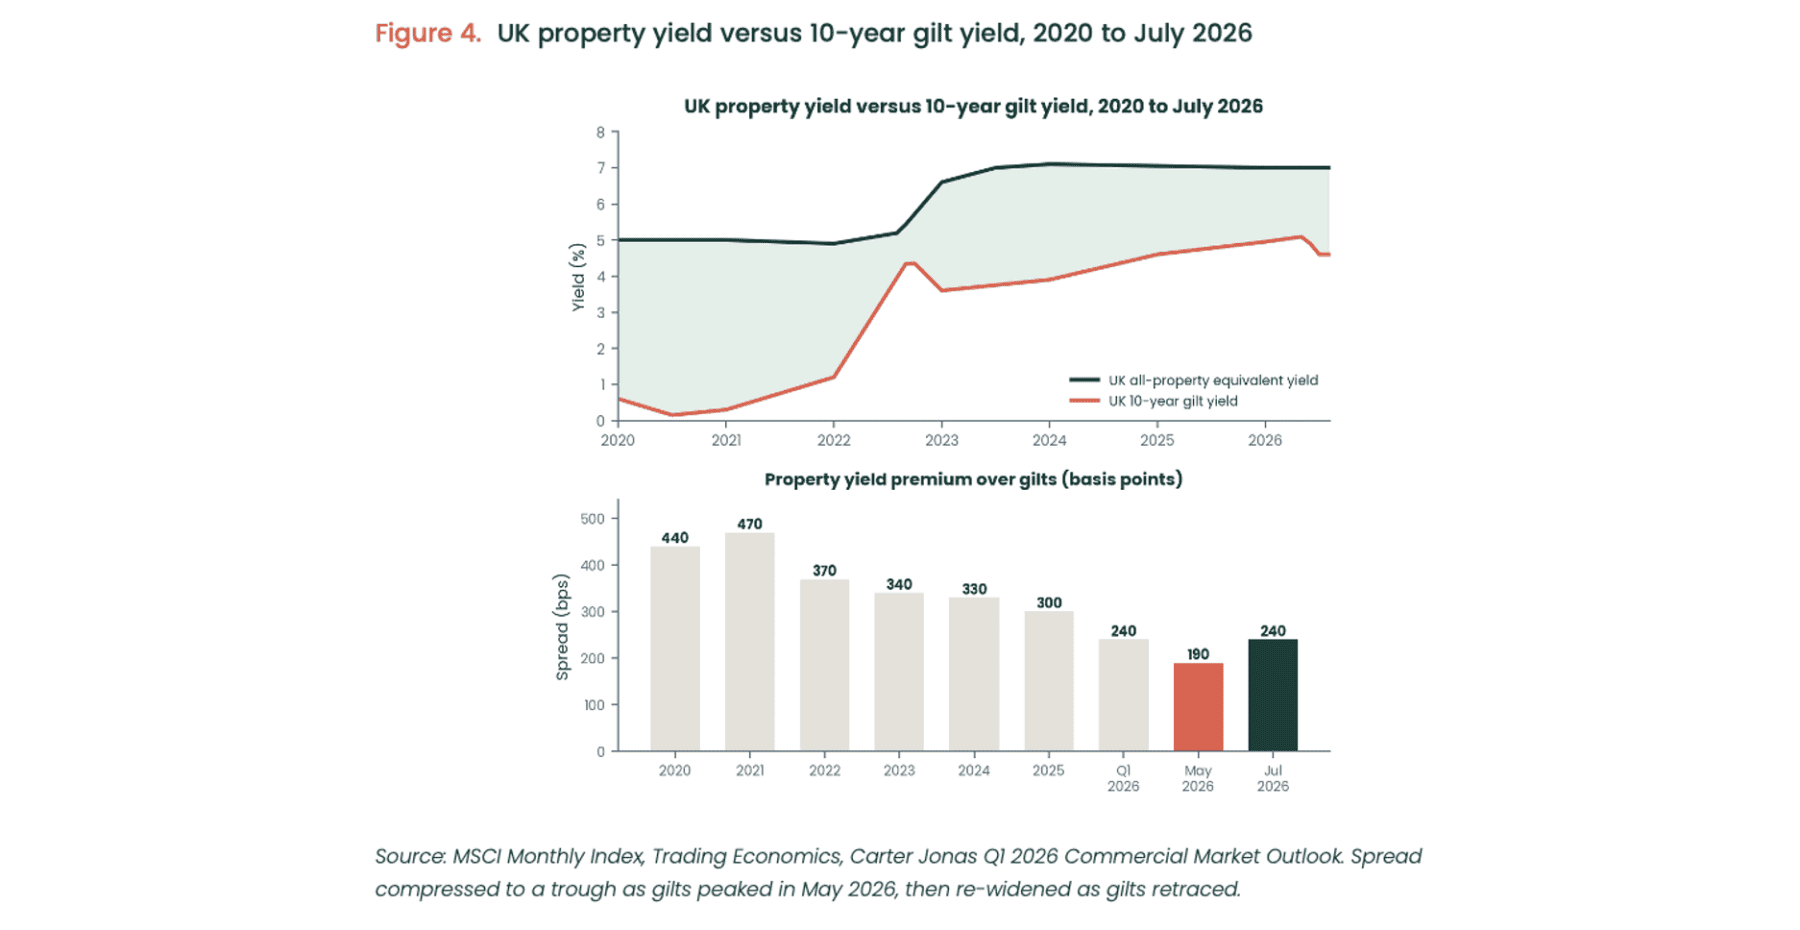
All-property equivalent yields have been broadly stable around 7.0% over the past two years, following the upward repricing from mid-2022 to early 2024. The spread between property equivalent yields and 10-year gilts compressed from a peak of approximately 350 basis points at the start of 2024 to a trough of approximately 190 basis points in mid-May 2026, when the gilt yield reached 5.10%. As gilts retraced toward 4.6% through late June and early July, that spread widened back to approximately 240 basis points.
The spread is worth addressing directly. At the May lows it made property look marginal against gilts on a pure yield-on-yield basis. That comparison was always incomplete, and the subsequent move illustrates why. A 10-year gilt delivers a fixed nominal coupon, exposes the holder to years of duration risk, and now correlates positively with equity returns. A prime commercial property at 6.5-7.0% delivers contracted income with indexation, a different and historically lower-volatility risk set, and genuine diversification. The headline spread, at any single point, understates the risk-adjusted advantage of well-underwritten property income.
5.2 Sector dispersion is wide and is the opportunity
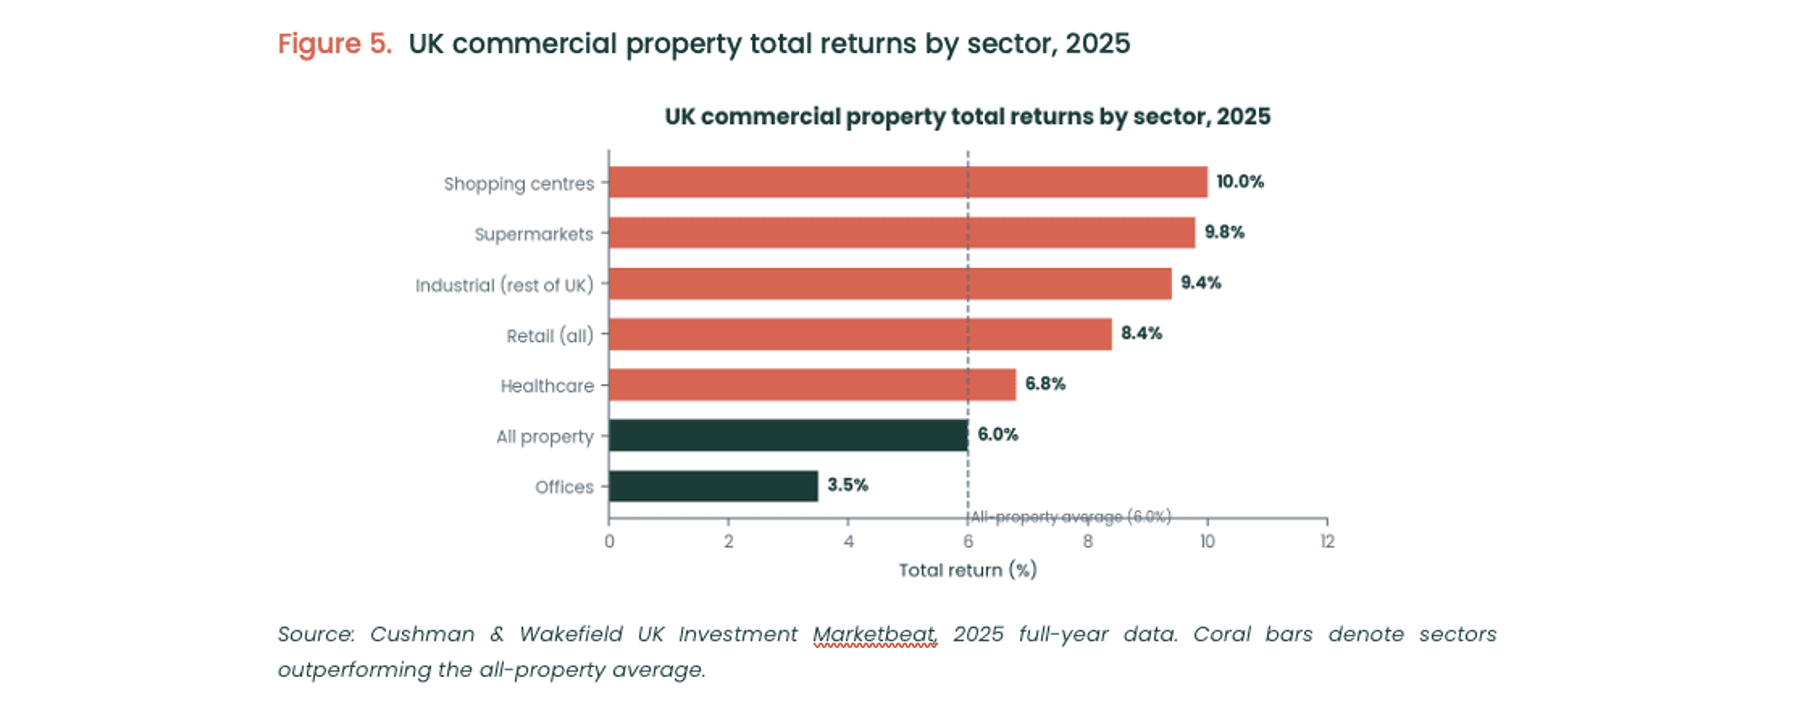
Full-year 2025 UK commercial property total returns were 6.0%, in line with bonds, but the headline masks material dispersion. Retail delivered 8.4%, with shopping centres at 10.0% and supermarkets at 9.8% leading the cycle on yield stability and improving occupier fundamentals. Healthcare returned 6.8% on sustained institutional demand. Rest-of-UK industrial delivered 9.4%, well ahead of the all-property average, while London and South East industrial ran lower. Offices delivered 3.5%, the weakest of the main sectors, with rest-of-South-East offices marginally negative and secondary stock materially worse than prime.
The pattern matters more than any single number. Within each sector the prime/secondary spread has widened, and tenant quality is increasingly the determinant of return. Dominant high streets and out-of-town parks outperformed weaker town centres. Well-located Grade A offices outperformed peripheral or older buildings. Primary care and pharmacy outperformed older care home portfolios. The dispersion creates the alpha opportunity for disciplined managers prepared to underwrite each sub-sector on its own merits rather than reaching for headline beta.
5.3 The opportunity beyond London: the UK’s core six regional cities
UK commercial real estate investment volumes reached £58 billion in 2025, up 5% on 2024. Momentum then cooled: Colliers records Q1 2026 volumes at £9.3 billion, 16% below the prior year and around 30% below the five-year quarterly average, as the energy shock and higher gilt yields weighed on transaction activity. London remained Europe’s leading investment destination by volume, though the more interesting story for income-led capital is the recovery visible across the UK’s core six regional cities.
The core six (Manchester, Birmingham, Bristol, Leeds, Glasgow, and Edinburgh) delivered approximately £1.9 billion of investment activity in the strongest recent quarter, according to Colliers, with Birmingham reaching a three-and-a-half-year high of around £740 million and Manchester strengthening as occupier demand and investor confidence improved together. Scottish activity firmed across Glasgow and Edinburgh. Occupier fundamentals are tight: Manchester Grade A office vacancy has fallen to around 0.6%, Leeds to 1.7%, and Bristol prime rents reached a record of £52.00 per square foot.
Three structural factors support the regional case. First, the yield gap: prime regional office yields stand at approximately 6.75% at the start of 2026, well above prime central London equivalents, with forecasters anticipating potential compression as activity normalises. Second, supply constraint: chronic under-supply of Grade A space across the regional cities is expected to persist, with development viability challenged by elevated construction and borrowing costs. Third, occupier demand: sustained office-attendance recovery is concentrating demand on high-quality, well-located workspace, anchored by national retailers, financial services, and professional services firms. For income-led strategies, the core six offer higher entry yields and longer-WAULT structures with strong national covenants. London remains a strategic core component of any UK allocation, and a portfolio that ignores the regional opportunity is leaving yield on the table.
5.4 Forecast environment: returns marked down, income doing the work
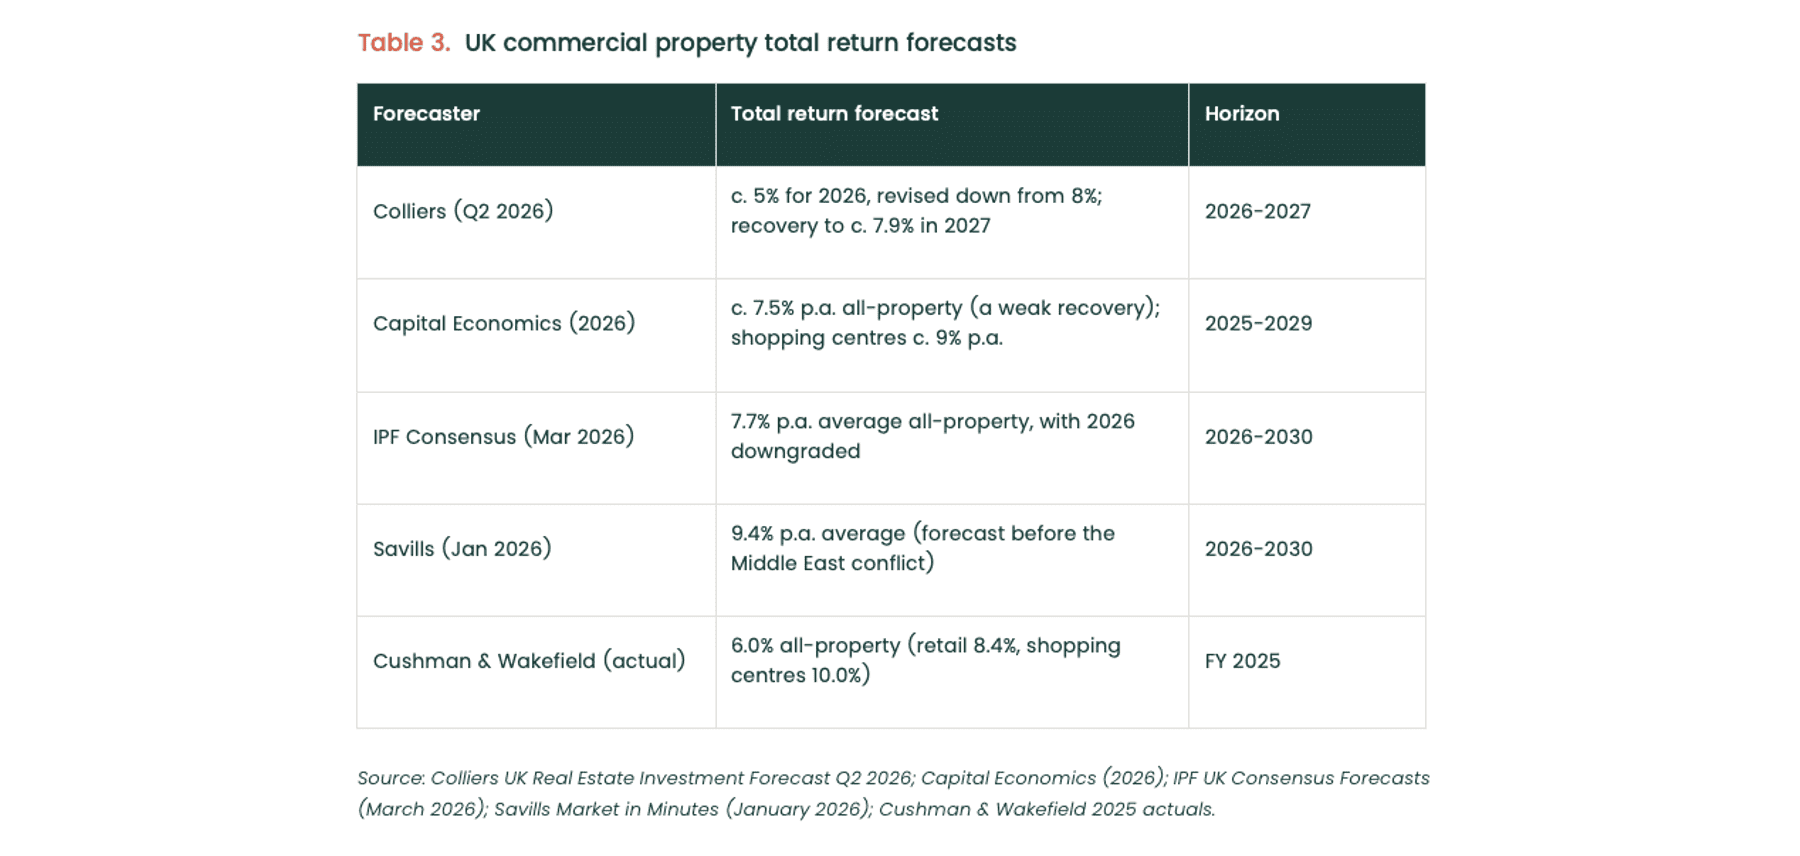
Forecasts have been trimmed through 2026 as gilt yields rose and credit conditions tightened. Colliers cut its 2026 all-property total return forecast from 8% to approximately 5%, with 2026 capital growth reduced to around 0.3%, and expects a recovery from 2027 as conditions ease. Capital Economics projects all-property total returns averaging approximately 7.5% per annum over 2025-2029, describing it as a weak recovery by past standards, with retail the top-performing sector. The March 2026 IPF consensus put all-property total returns at 7.7% per annum over 2026-2030, with the 2026 figure downgraded. Savills, forecasting before the conflict in January 2026, projected 9.4% per annum over 2026-2030.
The common thread is that near-term capital growth is expected to be muted, with income carrying most of the return. That is precisely the profile an income-led strategy is built to capture, and outsized returns are available with asset selection and understanding of growth expectations of the medium term.
HOUSE VIEW
We believe the next 24 months will reward investors who buy income-led prime assets at the back end of the repricing cycle. Headline return forecasts have been trimmed, and near-term capital growth will be limited. The underlying income story remains intact: income returns of 5-6%, rental growth around 3.0-3.5%, and a property-gilt spread that has widened again since May. For a strategy whose return is led by income rather than capital appreciation, that is a constructive setup and holds upside potential as markets correct over the medium term.
6. Why this resonates specifically with overseas investors
Taking The Gulf Cooperation Council countries for example, they are among the most dynamic sources of global investment capital. Deloitte reports that GCC sovereign wealth funds now manage close to US$6 trillion, more than 40% of the global SWF total, and are home to several of the ten largest funds worldwide. In the first half of 2025, Middle East sovereign wealth funds invested US$12.85 billion in European deals alone. Saudi Arabia’s Public Investment Fund manages around US$1.15 trillion, Abu Dhabi’s ADIA around US$1.11 trillion, and Kuwait’s KIA has crossed the trillion-dollar threshold. Family office capital across the region adds materially to that pool.
For UHNW families, single-family offices, and sovereign capital across the GCC, income-led UK commercial property aligns with several deeply embedded investment preferences.
-
Tangible asset preference
Real estate is a tangible, physical asset class, visible and measurable in a way that complex financial instruments are not. Altrata’s World Ultra Wealth Report 2025 finds that younger UHNW individuals allocate 12-24% of portfolios to real estate and luxury assets, compared with 4-6% for older cohorts. The preference is intensifying across generations.
-
Capital preservation alongside growth
Multi-generational wealth structures across the globe prioritise capital preservation as a core objective alongside growth. Income-led property, combining contracted cashflow with real asset backing, provides defensive characteristics that complement growth-oriented allocations to private equity, venture capital, and technology.
-
Rule-of-law jurisdictions
The UK legal system provides a transparent, predictable, and well-tested framework for property ownership, lease enforcement, and investor protection. English law governs the majority of international commercial contracts, and UK property rights are among the most robust globally. For overseas investors seeking stable, legally defensible income streams outside their home markets, the UK offers a natural destination, particularly through long-standing structures established over many decades which has seen the UK as a top tier investment destination.
-
Compatibility
Income-led commercial property can be structured to accommodate ethical conscious investment parameters. Lease-based income derived from permissible commercial activities, with conservative or no leverage, aligns with the core principles of various finance structures. The focus on tangible assets generating real economic utility resonates with the ethical foundations of many family investment frameworks.
-
The complement to domestic real estate
Many overseas investors already hold substantial domestic real estate exposure. UK income-led property provides a different risk-return profile, being a mature market with contractual income predictability and sterling denomination, that complements rather than duplicates domestic holdings. It is a geographic and structural diversifier within the broader real estate allocation.
HOUSE VIEW
We position UK income-led property in the overseas dialogue as the income complement to investor’s domestic real estate exposure. Domestic exposure captures the long-term capital growth of the regional development story. UK exposure captures the contracted, indexed income that supports current cashflow needs and intergenerational planning. Together they form a balanced real estate allocation.
7. Key risks and how they are managed
Income-led commercial real estate is not risk-free. Below we set out the principal risks investors should consider and the discipline a well-managed strategy applies to mitigate each.
Table 4. Principal risks in UK income-led commercial real estate
| Risk | Mitigation under a Greenridge mandate |
| Upward-only rent review ban | The ban is now law under the English Devolution and Community Empowerment Act 2026 but is not yet in force, expected no earlier than 2027. It affects new leases and catches upward-only open-market, index-linked, and turnover reviews. Fixed and stepped uplifts, where rent is ascertainable, are unaffected, and index-linked reviews may continue on a two-way basis. Greenridge prioritises fixed and stepped uplifts and long-WAULT leases and avoids reliance on the upward-only mechanic.
|
| Refinancing risk | Conservative LTV (below 55%), long-dated fixed-rate debt where possible, ICR cover of 2.0x or higher, and duration alignment between lease income and loan tenor. Active hedging of floating exposures.
|
| UK political and sovereign risk | UK political volatility is real but property income is asset-secured and largely insulated from short-term political cycles. Greenridge focuses on assets serving structural occupier demand rather than discretionary sectors.
|
| Liquidity | Private CRE is illiquid. We frame it as strategic capital sized at 15-20% of portfolio, with liquid allocations sized to handle near-term needs. Fund structures typically include defined exit windows and limited redemption rights.
|
| Sector concentration | Offices delivered 3.5% total return in 2025 versus 10% for shopping centres. We underweight secondary offices and overweight sectors with structural demand: prime offices (or locations that will become this), grocery anchored retail, retail warehouses, last-mile logistics, and sectors that support demographic shifts such as those supporting healthcare.
|
| Inflation persistence | CPI eased to 2.6% by June 2026 but services inflation remains elevated and the path is uncertain. Indexed and fixed uplifts provide a contractual inflation hedge that bond coupons and equity dividends do not. Greenridge requires inflation-protection provisions in new lease structuring.
|
Source: Greenridge analysis. Source data: Cushman & Wakefield Marketbeat 2025-Q1 2026; Carter Jonas Commercial Market Outlook; MSCI; English Devolution and Community Empowerment Act 2026.
-
Specific positioning on the rent review reform
We expand on the reform because it is the most frequently raised concern among advisers in 2026. Our analysis rests on four points. First, existing leases are unaffected; the ban applies only to new leases granted after commencement, so long-WAULT existing portfolios are unchanged. Second, fixed and stepped uplifts, where the rent is ascertainable at grant, sit outside the ban entirely, and these are the mechanisms Greenridge prioritises. Third, index-linked reviews remain available on a two-way basis, and the government has committed to consult on caps and collars before commencement. Fourth, the reform differentiates prime from secondary: owners of prime, well-covenanted assets retain genuine pricing power, while owners of secondary assets that relied on the upward-only mechanic to manufacture rental growth are exposed.
HOUSE VIEW
The rent review reform strengthens the case for our underwriting discipline. It penalises sponsors that depended on contractual asymmetry rather than asset quality. Greenridge’s portfolio is structured around fixed and stepped uplifts, prime locations, and strong covenants, with limited reliance on upward-only open-market reviews. We see the reform as net positive for our strategy and net negative for less disciplined competitor portfolios, and expect it to push some secondary owners to refinance or sell, creating acquisition opportunities for disciplined capital.
8. Implementation framework for advisers
For advisers and family office allocators considering an income-led UK commercial real estate allocation for the first time, we propose the following framework.
8.1 Sizing the allocation
We recommend a target allocation of 15 to 20% of total portfolio assets to income-led private commercial real estate for UHNW clients with a multi-year horizon. Below 10%, the diversification benefit is too small to meaningfully alter outcomes. Above 25%, the liquidity profile of the portfolio is materially impaired. Within the 15-20% range, we suggest splitting between core (long-WAULT, indexed or stepped, investment-grade tenanted) and core-plus (active asset management opportunity) in approximately 70:30 proportions.
8.2 Target asset characteristics
Strong covenants. Tenants should be investment-grade or have institutional-quality financial profiles. Covenant strength is a primary acquisition screen.
Long WAULT. Eight years or above to expiry is the threshold for income certainty, with above twelve years preferable where pricing supports it.
Indexation or fixed uplifts. Inflation protection should be built into the lease structure through fixed or stepped uplifts, or two-way index-linked reviews, rather than assumed from open-market reviews.
Conservative leverage. LTV below 55-60% with long-dated fixed-rate debt where possible, and ICR of 2.0x or better.
Liquid sub-markets. Established locations with deep occupier demand and clear comparable transaction evidence.
8.3 Manager selection criteria
Manager selection is critical in private real estate, where the dispersion of outcomes between managers is wider than in most public-market strategies. Advisers should evaluate four criteria.
Underwriting discipline. Evidence of rigorous due diligence, selectivity, and willingness to walk away from transactions that do not meet standards.
Cycle track record. Demonstrated performance through both expansion and downturn phases. Managers who built portfolios only in benign conditions have not been tested.
Alignment of interest. Co-investment by the manager, transparent fee structures, and clear governance arrangements.
Operational capability. Active asset management to drive occupancy, rent collection, lease renewal, and covenant strengthening. Income-led strategies are operational, not passive.
9. Conclusion
The 2026 macro environment has exposed structural fragilities in conventional portfolio construction. Equity-bond correlations are unreliable across regimes. Inflation has cooled from its peak but the path is uncertain. Geopolitical risk reasserted itself sharply, then eased, in a matter of months. UK political volatility continues to carry a sovereign risk premium. Within this picture, the question for UHNW investors and their advisers is how to allocate to real assets in a way that genuinely delivers the diversification and income certainty that other allocations cannot.
Underwritten income, drawn from prime UK commercial property under long-dated leases with investment-grade tenants, conservative leverage, and built-in inflation protection, sits in a category of its own. It is a contracted, indexed, asset-backed income stream that performs structurally differently from equity, credit, or generic real estate exposure when conditions deteriorate. The events of 2026, a fast shock and a fast unwind, showed the value of income that does not reprice on the headlines.
For foreign capital, the alignment is structural and outlasts any single cycle. Tangible asset preference, capital preservation alongside growth, multi-generational structures, the appeal of rule-of-law jurisdictions, and compatibility with ethically conscious frameworks combine to make UK income-led property a strategically suitable allocation, particularly in current conditions.
Greenridge’s house view is that 15-20% of a balanced portfolio assets should be allocated to income-led private commercial real estate, sourced through managers with demonstrated underwriting discipline, multi-cycle track records, aligned governance, and active asset management capability. We believe this allocation produces materially better portfolio outcomes than conventional 60/40 construction across a wide range of macro scenarios, and that the current environment is the right time to establish or increase the position.
Certainty is the scarce asset of this cycle. Contractual income, properly underwritten and conservatively structured, delivers it.
References
Market data and third-party research referenced in this paper are drawn from the sources below. Data described as current is stated as at early July 2026 unless otherwise indicated.
- Trading Economics. United Kingdom Government Bond 10Y (peak of 5.10% on 12 May 2026; c. 4.6% by early July 2026). tradingeconomics.com/united-kingdom/government-bond-yield
- Bank of England. Monetary Policy Summary and Minutes, 17 June 2026 (Bank Rate held at 3.75%, 7-2 vote). bankofengland.co.uk/monetary-policy-summary-and-minutes/2026/june-2026
- Bank of England. Monetary Policy Summary and Minutes, 29 April 2026. bankofengland.co.uk/monetary-policy-summary-and-minutes/2026/april-2026
- Office for National Statistics. Consumer price inflation, UK: May 2026 (CPI 2.8%; services 3.7%; core 2.6%). ons.gov.uk/economy/inflationandpriceindices/bulletins/consumerpriceinflation/may2026
- House of Commons Library. Inflation in the UK: Economic indicators (updated July 2026). commonslibrary.parliament.uk/research-briefings/sn02792/
- Al Jazeera. Oil prices fall, stocks rally as US, Iran sign framework to end war (18 June 2026). aljazeera.com/economy/2026/6/18/oil-prices-fall-stocks-rally-as-us-iran-sign-framework-to-end-war
- Trading Economics. Brent Crude Oil (c. $72 per barrel, early July 2026; OPEC+ output increase). tradingeconomics.com/commodity/brent-crude-oil
- Wikipedia. 2026 Strait of Hormuz crisis (timeline of closure, blockade, and reopening). en.wikipedia.org/wiki/2026_Strait_of_Hormuz_crisis
- Cushman & Wakefield. UK Investment Marketbeat, 2025 full-year data (all-property 6.0%; retail 8.4%; shopping centres 10.0%; supermarkets 9.8%; rest-of-UK industrial 9.4%; healthcare 6.8%; offices 3.5%; volumes £58bn). cushmanwakefield.com/en/united-kingdom/insights/uk-marketbeat/investment-marketbeat
- Colliers. UK Real Estate Investment Forecast Q2 2026 (2026 all-property total return cut from 8% to c. 5%; Q1 2026 volumes £9.3bn; regional data). colliers.com/en-gb/research/reif-q2-2026
- Colliers. UK Real Estate Investment Forecasts Q4 2025 (core six regional cities; Birmingham £740m). colliers.com/en-gb/research/uk-real-estate-investment-forecasts-q4-2025
- Capital Economics. UK Commercial Property Outlook: property recovery faces numerous headwinds (all-property c. 7.5% p.a. 2025-2029; shopping centres c. 9% p.a.). capitaleconomics.com/publications/uk-commercial-property-outlook
- Investment Property Forum. UK Consensus Forecasts, March 2026 survey (7.7% p.a. all-property, 2026-2030). ipf.org.uk/research/ipf-uk-consensus-forecasts.html
- Savills. Market in Minutes: UK Commercial, January 2026 (9.4% p.a. five-year forecast, pre-conflict). savills.co.uk/research
- Carter Jonas. UK Commercial Market Outlook, Q1 2026 (all-property equivalent yield c. 7.0%; rental value growth c. 3.5% p.a.). carterjonas.co.uk/commercial-market-outlook
- English Devolution and Community Empowerment Act 2026 (Royal Assent 29 April 2026): ban on upward-only rent reviews. Commentary: TLT LLP, Baker McKenzie, Blake Morgan, and Charles Russell Speechlys (April-May 2026).
- Deloitte. Gulf Cooperation Council sovereign wealth funds at the forefront of a strategic global expansion (GCC SWFs c. US$6trn, >40% of global total, per Global SWF), November 2025. deloitte.com
- Dakota. Middle East Sovereign Wealth Funds: US$3.2T Opportunity (H1 2025 US$12.85bn European deals; PIF, ADIA, KIA sizes), January 2026. dakota.com/resources/blog/middle-east-sovereign-wealth-funds-3.2t-opportunity
- Altrata. World Ultra Wealth Report 2025 (younger UHNW allocate 12-24% to real estate and luxury vs 4-6% for older cohorts). altrata.com
- Long Angle. 2026 High-Net-Worth Asset Allocation Study (over a quarter of net worth in private and alternative assets). longangle.com/research
- Cambridge Associates. 2026 Outlook: Portfolio-Wide Views (endowment equity allocation 51.7% in 2015 to 64.8% in 2025). cambridgeassociates.com
- Oppenheimer Asset Management. 2026 Market Outlook (equity risk premium c. 0.02%). oppenheimer.com
- BlackRock Investment Institute. 2026 outlook and stock-bond correlation commentary (44 of 46 AI stocks with 20%+ drawdowns in 2025; correlation reversion). blackrock.com / ishares.com
- State Street Investment Management. Mind on the Market: 60/40 strategy (2022 drawdown; correlation regime). ssga.com
- Accordant Investments. By the Numbers: private real estate (NCREIF / NFI-ODCE; income spread c. 252bps over US 10Y since 2000). accordantinvestments.com
- Nareit / CEM Benchmarking. REIT and private real estate performance study, 2024 (20-year Sharpe and volatility). reit.com
- Schroders. UK Real Estate Outlook, January 2026 (2022-2024 values fell c. 25%; industrial rents +20%). schroders.com
Methodology note
Portfolio modelling. The portfolio scenarios in Table 2 use historical returns and volatilities for the underlying asset classes drawn from the NCREIF Property Index (private UK CRE), Bloomberg (gilts and global aggregate bonds), and MSCI (UK and US equities) over the 20 years to December 2025. Volatility figures are annualised standard deviations of quarterly returns, adjusted for valuation smoothing where applicable. The scenarios assume annual rebalancing and a private CRE allocation structured as core/core-plus in a 70/30 split. Past performance is not a reliable indicator of future results, and actual outcomes will vary with manager selection, fee structures, and market conditions.
Yield ranges and forecasts. Yield ranges quoted in Tables 1 and 3 are drawn from publicly available data from the named institutions as at the dates indicated. Where ranges are quoted, they reflect the spread between prime and secondary assets within the relevant sector. Forecasts cited from third parties reflect the methodology of those institutions and may have been prepared on different bases and at different dates; the Savills forecast in Table 3 predates the 2026 Middle East conflict.
Chart data. Figures 1, 2, 4, and 5 use indicative monthly or quarterly data points compiled from the named sources. Approximations have been used where high-frequency data is not available in the public domain; the resulting visualisations are intended to represent the broad shape and direction of the underlying series rather than precise period-end values.
Important information
This whitepaper has been prepared by Greenridge Investment Management Limited for informational purposes only and is directed at Professional Clients and Eligible Counterparties as defined by the FCA Rules. It does not constitute investment advice, an offer, or a solicitation to buy or sell any financial instrument, nor does it form the basis of any contract or commitment. Recipients should not rely on this document as a substitute for the exercise of their own judgement or for taking independent advice on any matter discussed.
Greenridge Investment Management Limited is an Appointed Representative of Robert Quinn Advisory LLP, which is authorised and regulated by the Financial Conduct Authority. Past performance is not a reliable indicator of future results. The value of investments and the income from them can go down as well as up and investors may not get back the amount originally invested.
Forecasts, projections, illustrative modelling, and forward-looking statements contained in this document are based on assumptions about future events that may not prove correct, and are not guarantees of future performance. Actual outcomes may differ materially. Statements identified as Greenridge’s house view reflect the current opinion of the Greenridge Investment Management Limited investment team and are subject to change without notice.
All data and third-party references are believed to be accurate as at the date of publication but have not been independently verified. No representation or warranty, express or implied, is made as to the accuracy or completeness of any information contained herein. Greenridge Investment Management Limited accepts no liability for loss arising from the use of this information.
Greenridge Investment Management Limited is registered in England and Wales, No. 07901236. Registered office: 3rd Floor, 4-7 Manchester Street, London W1U 3AE.
© Greenridge Investment Management Limited 2026. All rights reserved.